Results Analysis
Performance on multiple models according to mutation-based structure information
To build a robust predicting protein stability changes model, dataset S1676 is used to train a model using 10-fold cross-validation. The results of our methods are replicated 10-fold cross-validation 20 times with shuffling the training data. Based on the availability of the PDB structure, we proposed four models MU3DSP^str, MU3DSP^seq, MU3DSP and MU3DSP^* to conduct comparative tests. When assuming that structures of wild-type and mutation proteins are unavailable for the training dataset, mutation-based structure features would get from G2S (MU3DSP*).
Table 1. Performance of 10-Fold cross-validation on Dataset S1676
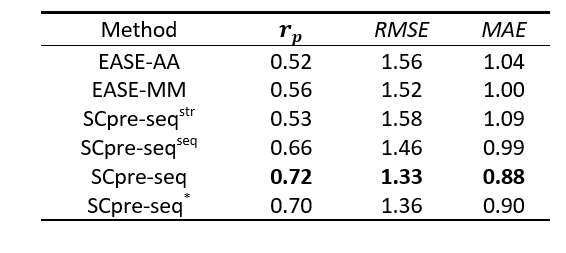

Figure 1. The Pearson correlation coefficient of 10-fold cross-validation for six models EASE-AA, EASE-MM, MU3DSP^str, MU3DSP^seq, MU3DSP and MU3DSP^* on the training dataset
MU3DSP achieves state-of-the-art performance on testing sets
To evaluate the robustness of our model, we used S236, S543 as the independent testing datasets. MU3DSP compared with nine commonly used methods including EASE-AA, EASE-MM, MUpro, I-Mutant2.0, INPS, SAAFEC-SEQ, DDGun and PoPMuSiC, MAESTRO on different testing datasets. Among them, EASE-AA, EASE-MM(EASE-MM-web), MUpro, sequence-based version of I-Mutant2.0(I-MutantA), INPS, SAAFEC-SEQ, DDGun predict ∆∆G starting from sequence and mutation residues while the structure-based version of I-Mutant2.0(I-MutantB), PoPMuSiC, MAESTRO required structures as input. The results are shown in Figures 2 and 3 for S236 and S543, respectively.
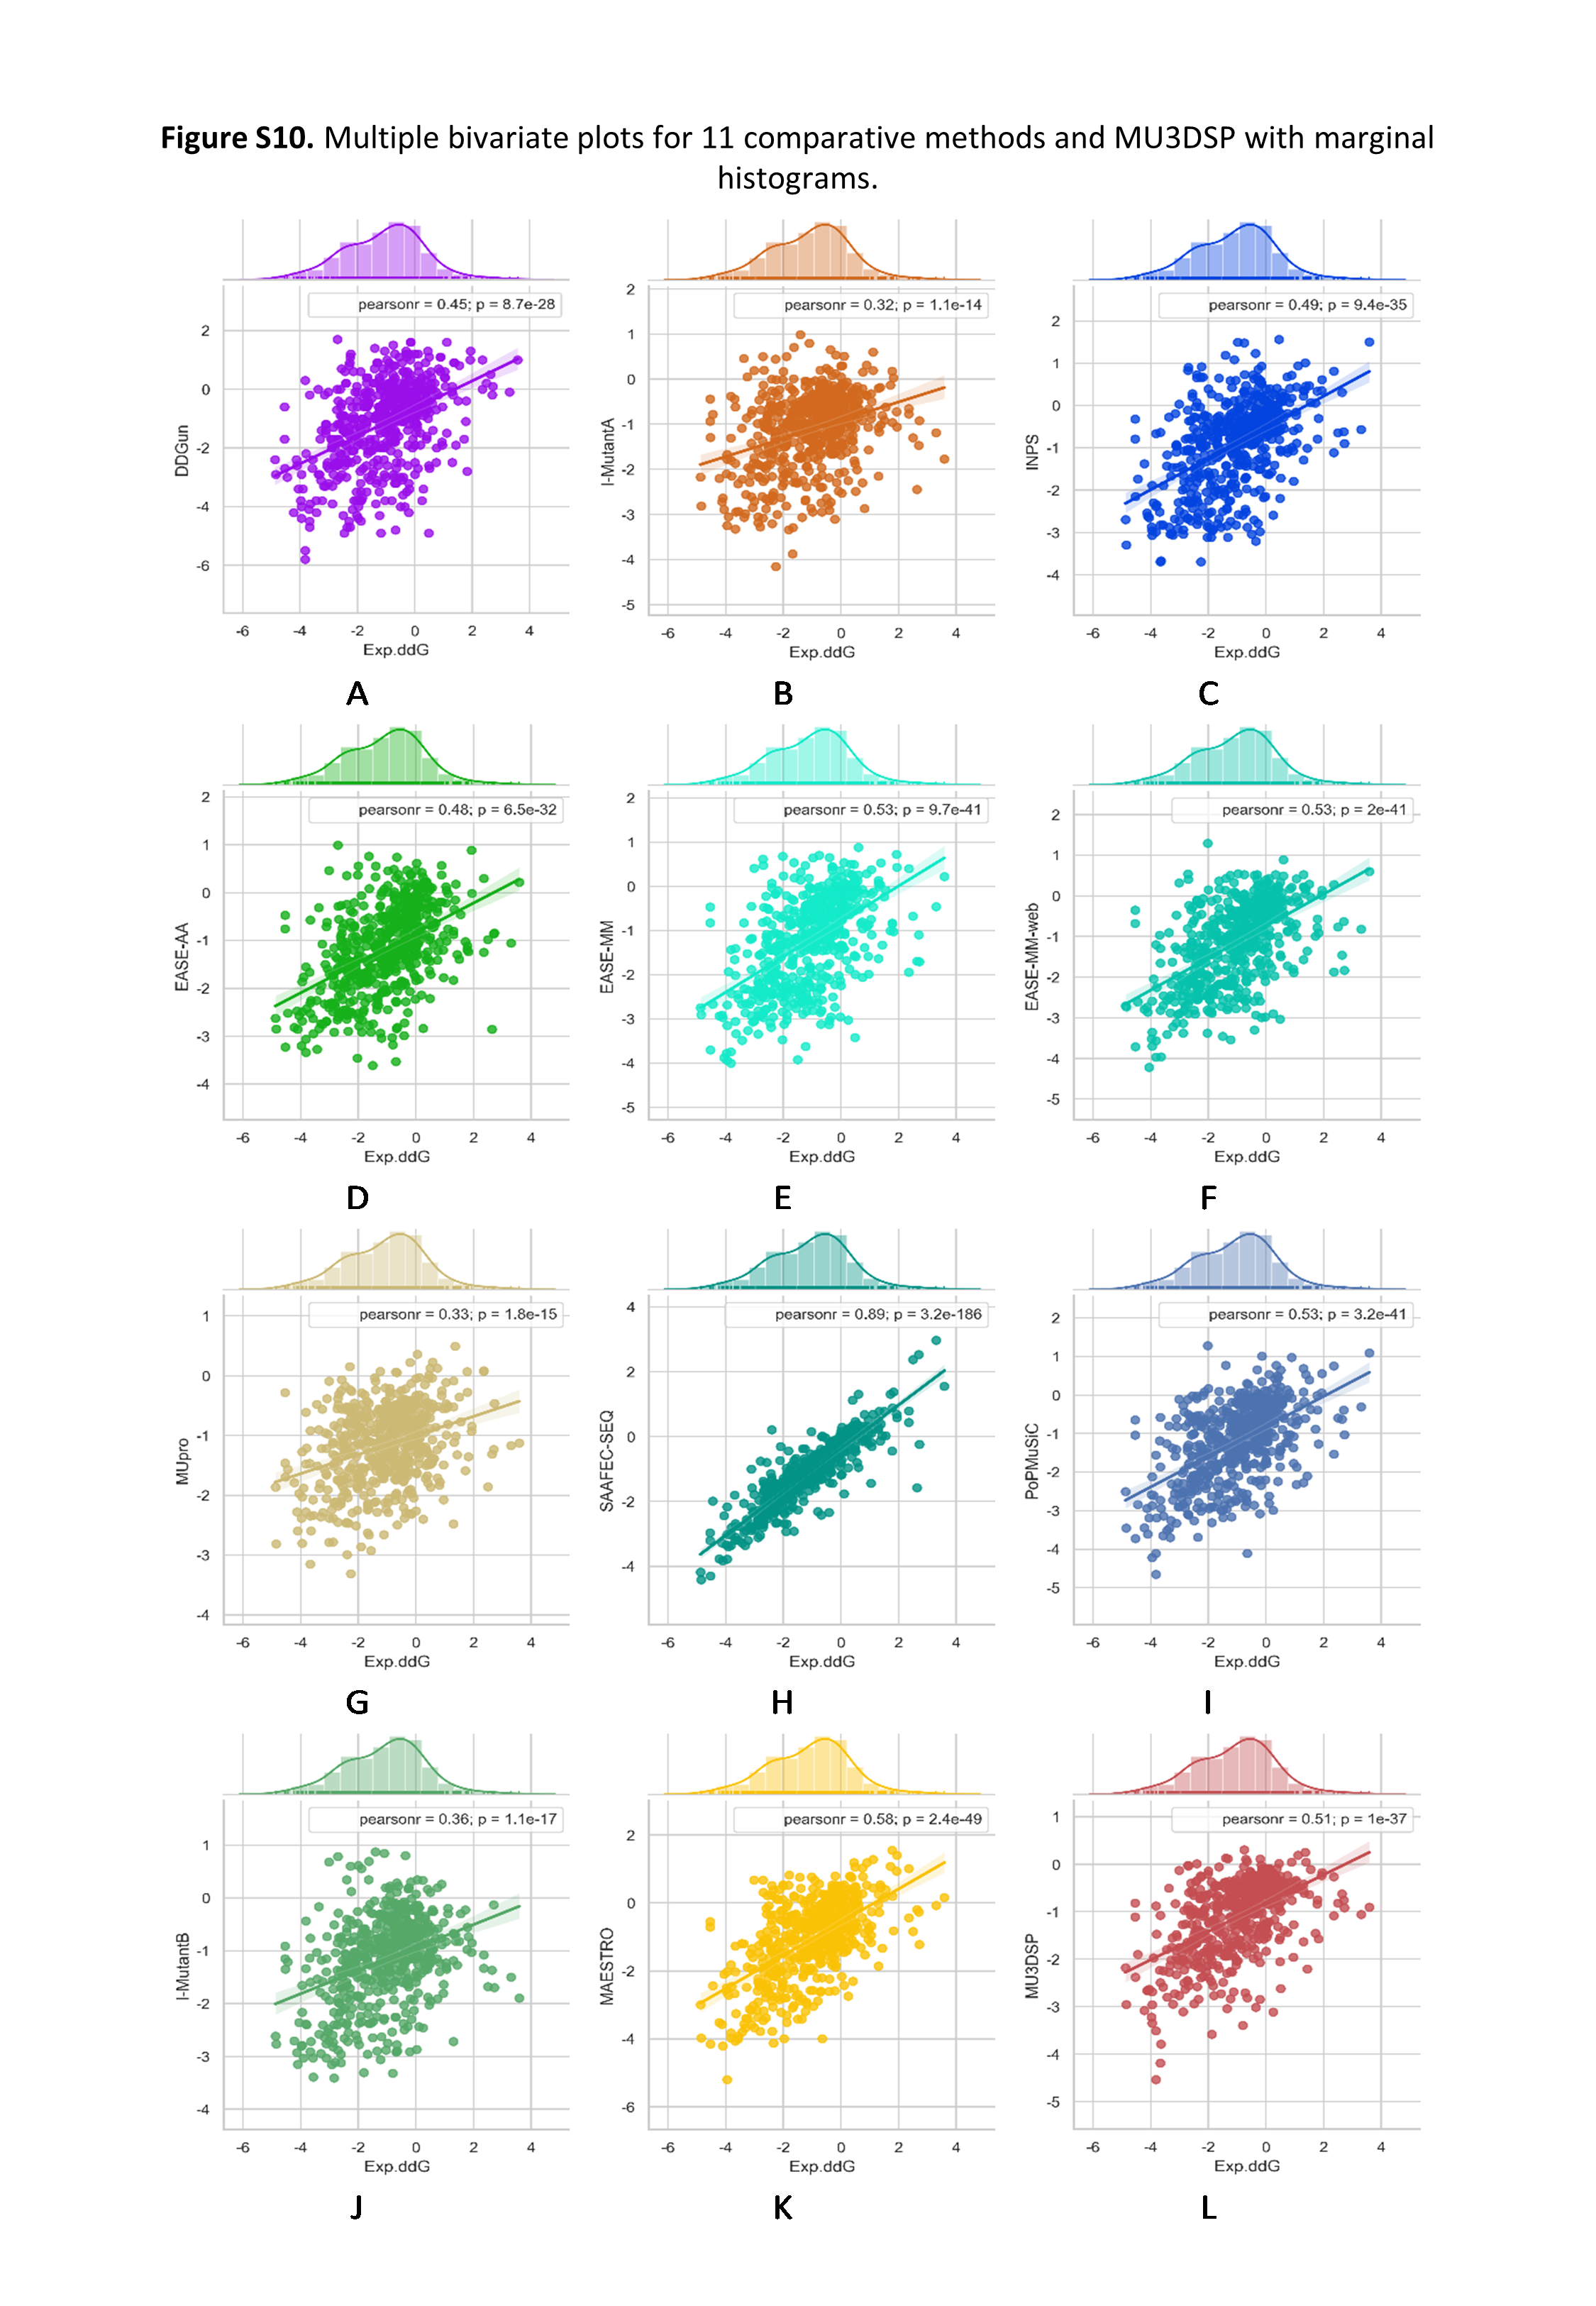
Figure 2. Multiple bivariate plots for 11 comparative methods and MU3DSP with marginal histograms on dataset S236.
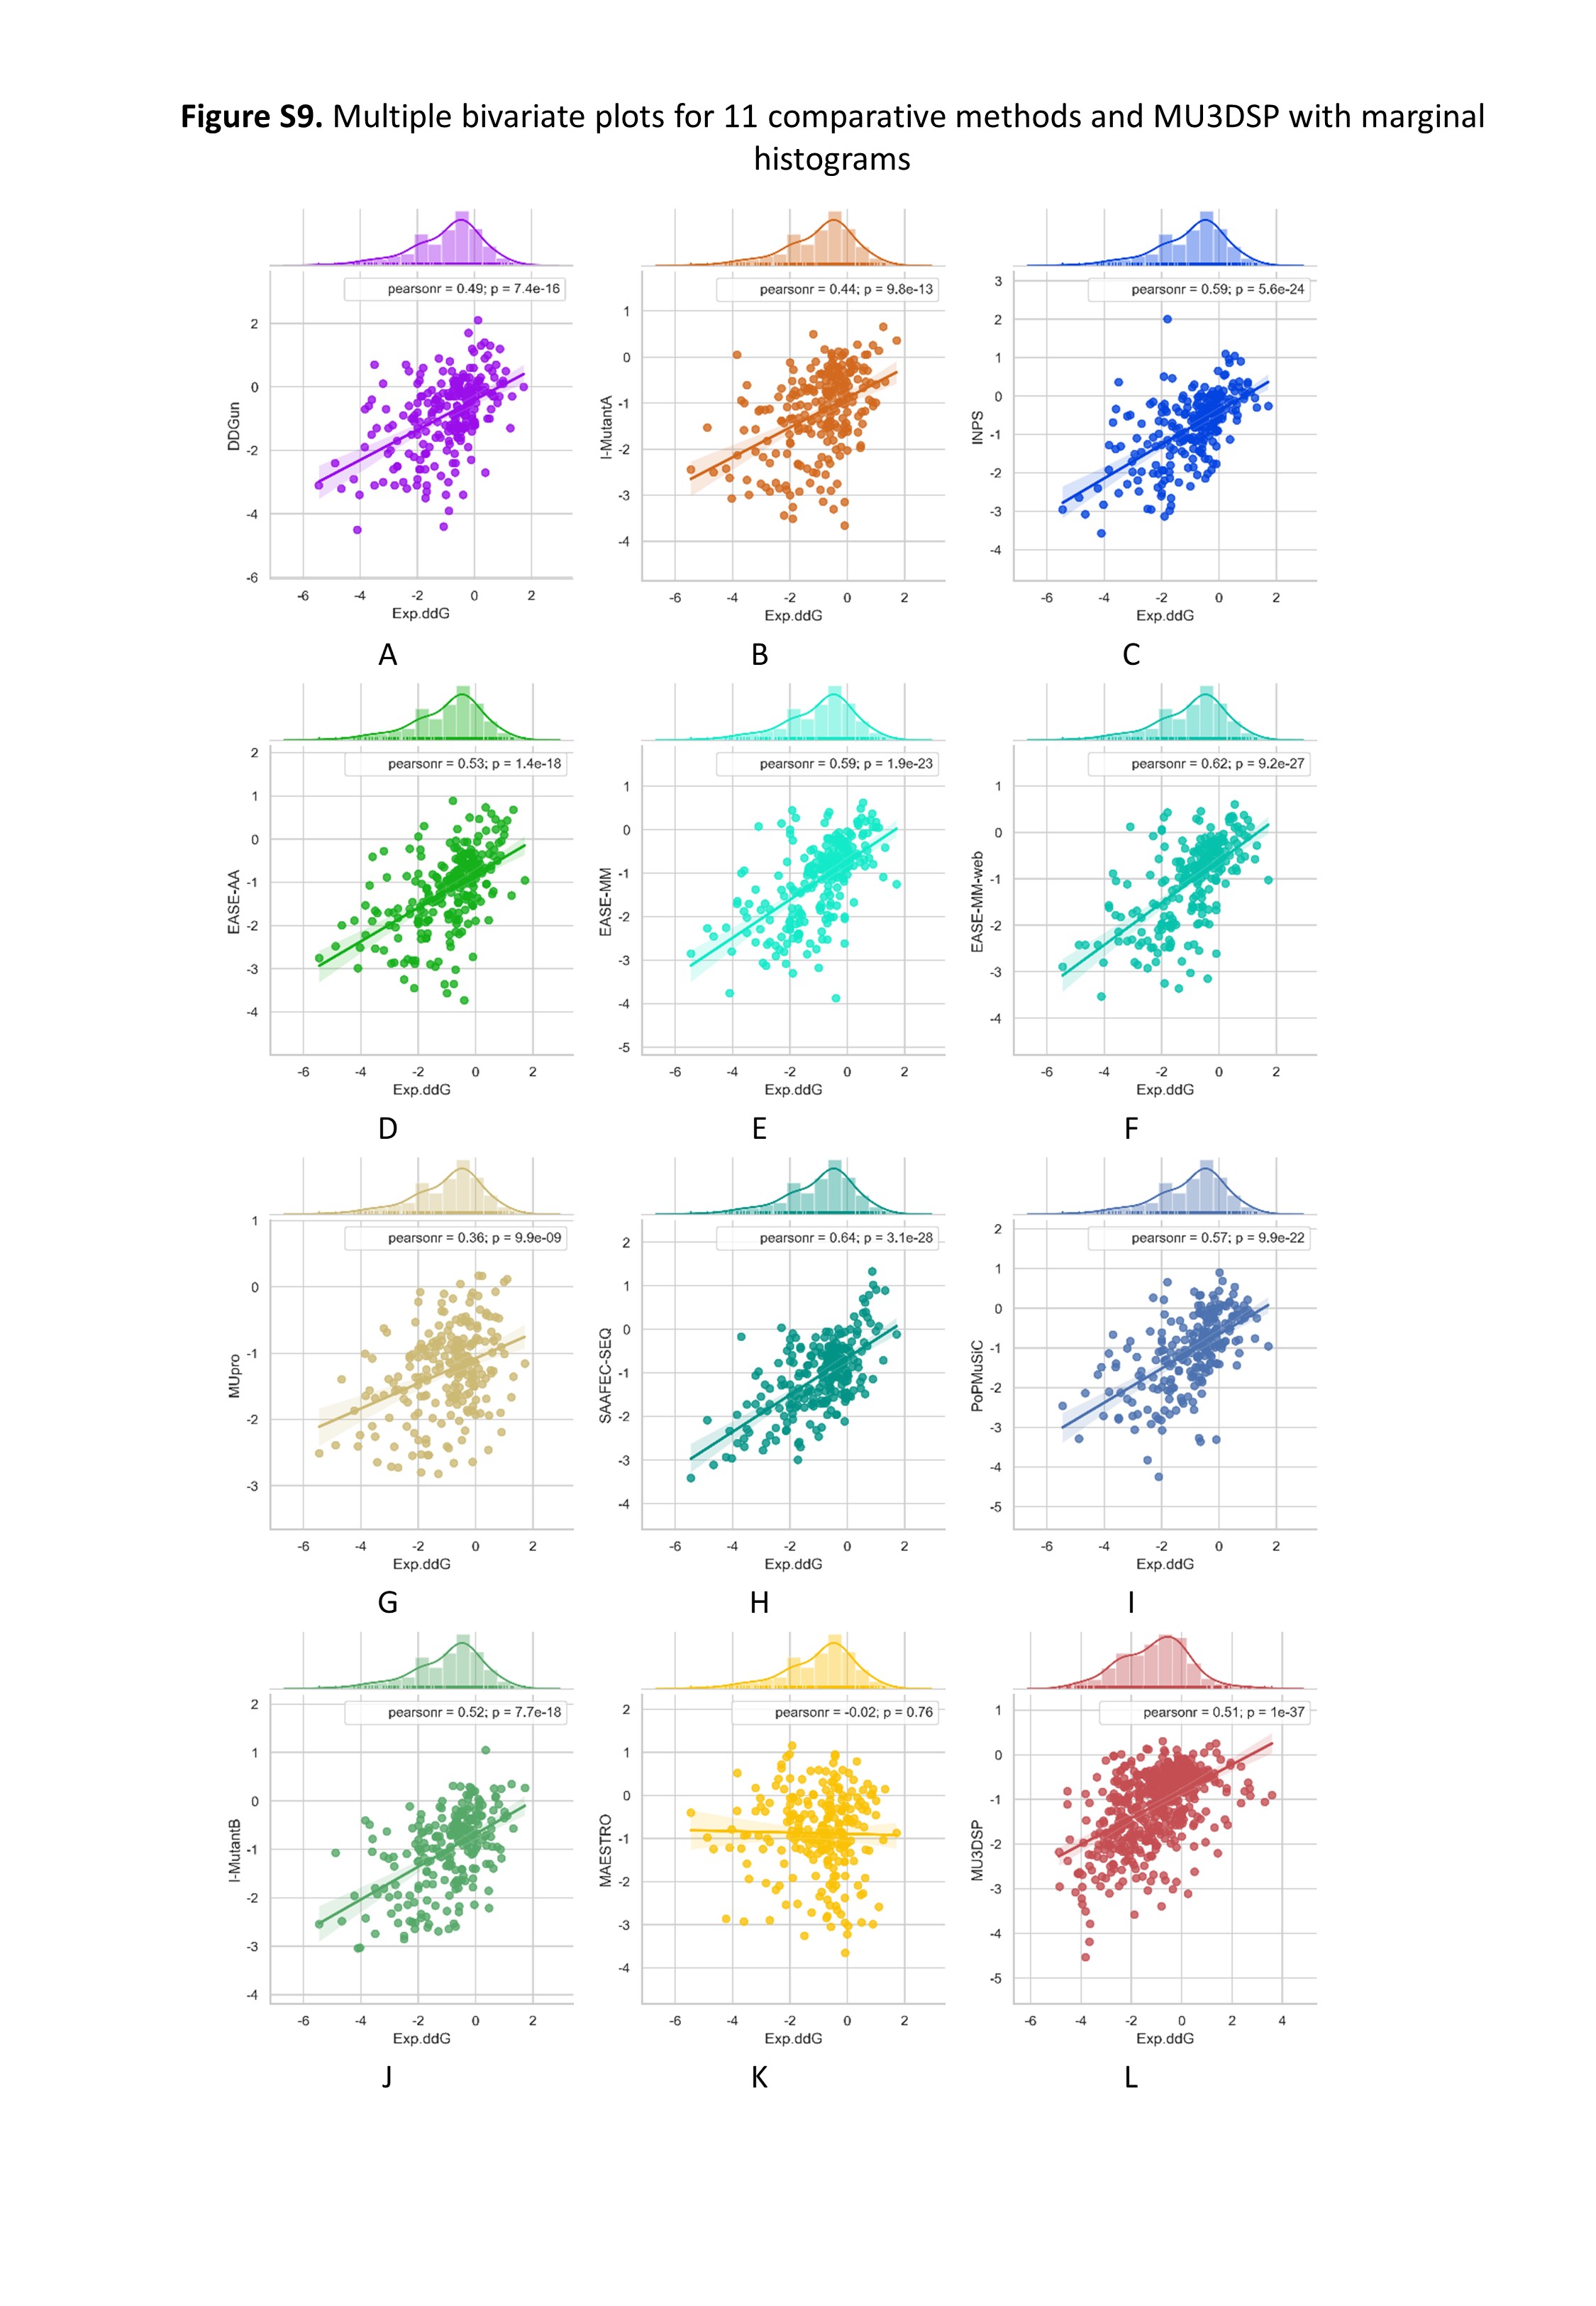
Figure 3. Multiple bivariate plots for 11 comparative methods and MU3DSP with marginal histograms on dataset S543.